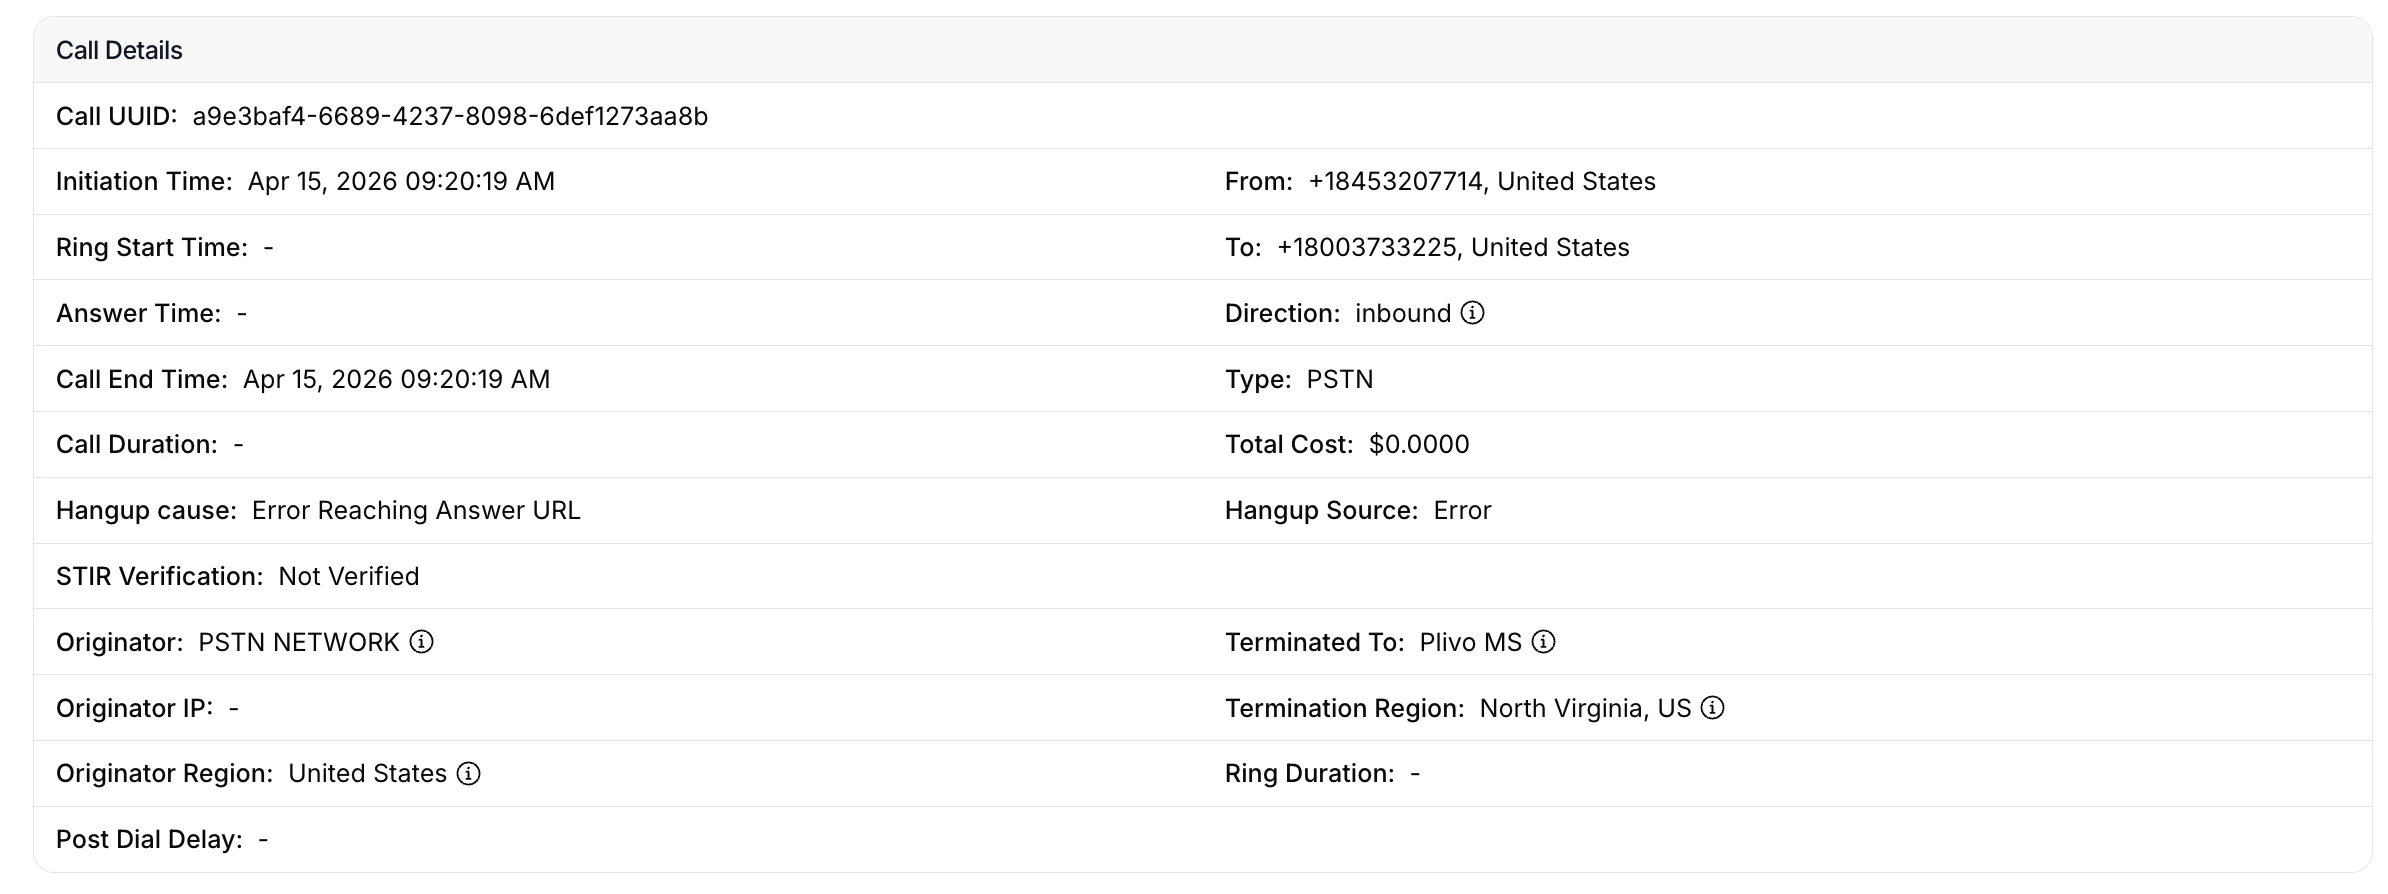
Call details
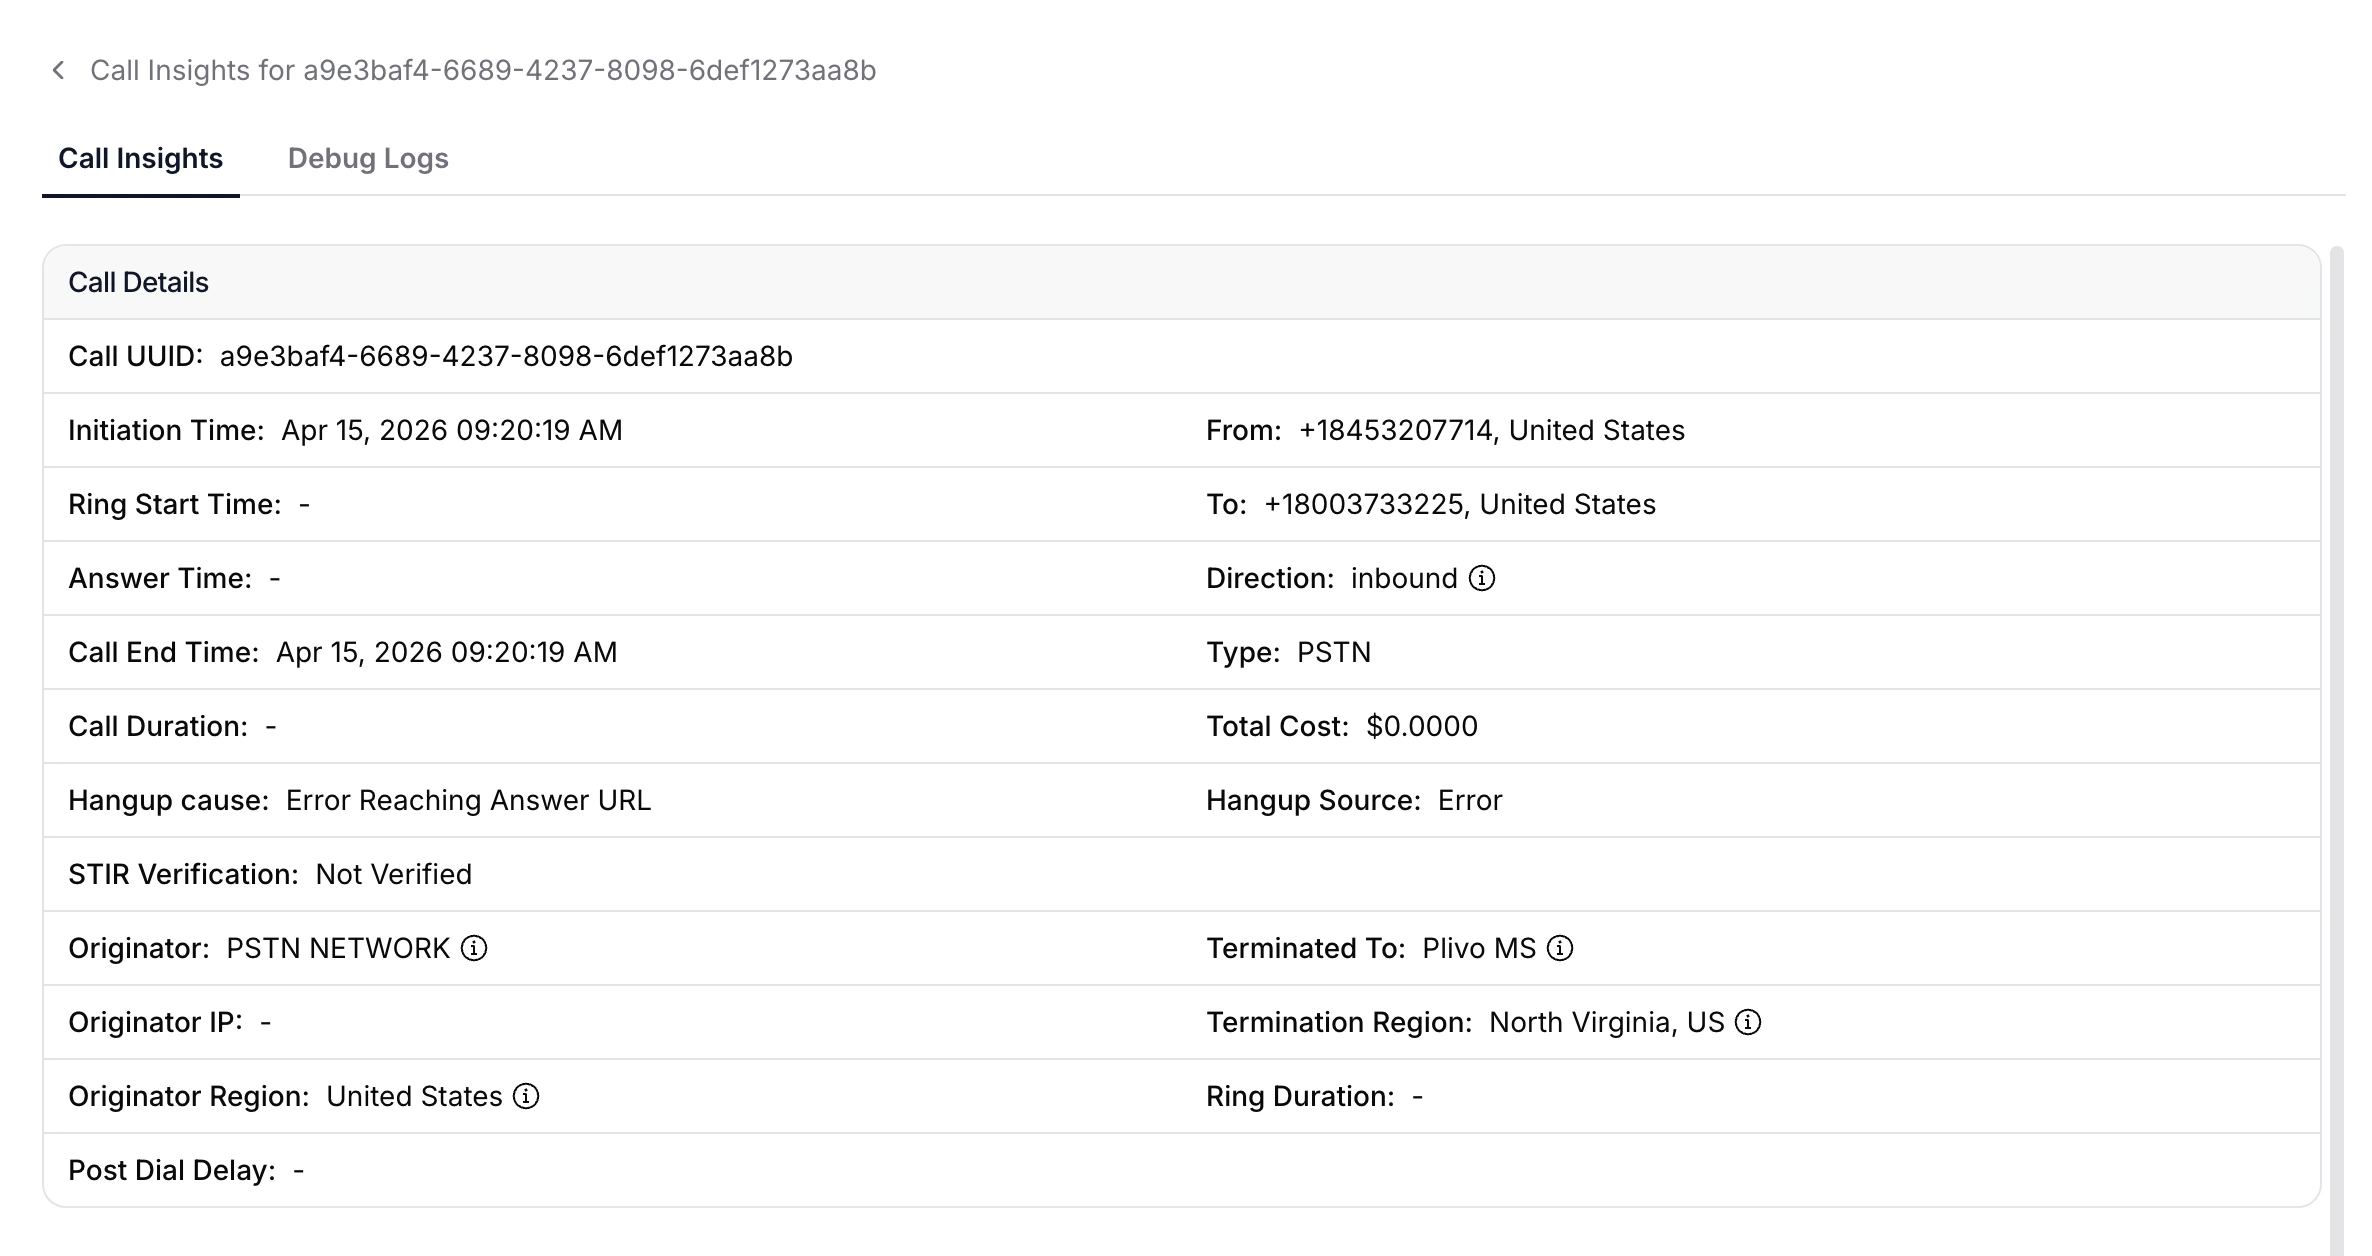
- Initiation Time: Time at which the call was initiated, displayed as date timestamp
- Ring Time: Delta time it took for ring to start after the call was initiated
- Answer Time: Delta time it took for the call to be answered after ringing started
- End Time: Time at which the call was hung up, displayed as date timestamp
- Duration: Duration of the call — the interval between answer time and end time
- From: The source number from which the call originated
- To: The destination number to which the call was made
- Direction: The direction of the call — either Inbound or Outbound from Plivo’s perspective
-
Type: Either PSTN or SIP depending on the direction (inbound or outbound) and the from and to numbers:
For inbound calls
- If the call was made from a PSTN number, the type is PSTN.
- If the call was made from a SIP endpoint, the type is SIP.
- If the call was made to a PSTN number, the type is PSTN.
- If the call was made to a SIP endpoint, the type is SIP.
- Total Cost: Calculated as calling rate times billed duration. By floating the mouse over an info icon, you can see the details in a tool tip.
- STIR Verification:
-
Suspected Issues: Possible issues with the call
- One-Way Audio: Audio level was too low to be audible or nonexistent on either or both the streams for most of the call duration
- Broken Audio: voice data (audio) was lost intermittently due to loss of voice packets in transmission
- Robotic Audio: Audio packets might be overlapping due to high jitter and causing a choppy audio effect
- High Connect Time: High delay in the time taken between call initiation and call ringing
- Audio Lag: Delay in the transmission of audio to the destination
- Low Audio Level: Audio is audible but too low to be clear for most of the call on either or both of the streams
Note: Issues on other connected call legs that may have adversely affected the call experience on the searched call leg are also included in the list of suspected issues. - Plivo Quality Score: Each call is rated between 1 to 5 based on the audio quality stats recorded for the call.
Call relations
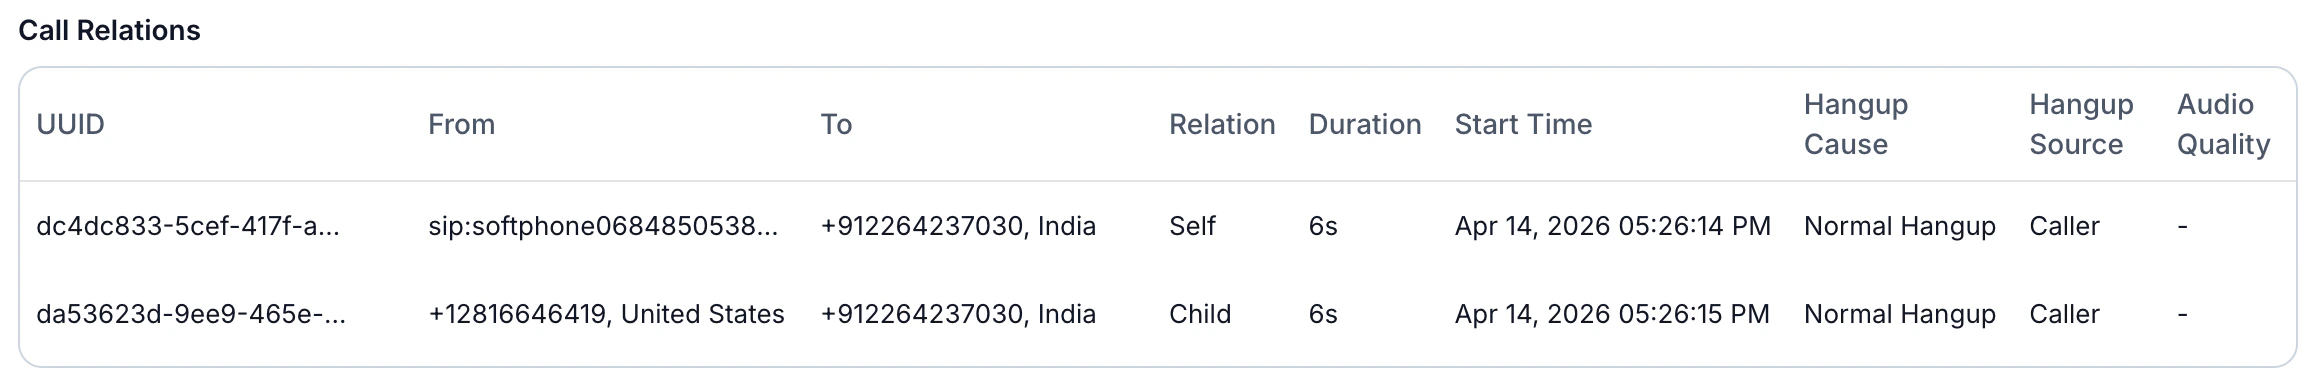
- Relation: The relationship between the call legs
- Self identifies the call leg whose page we’re on.
- Parent identifies the A leg call that initiated this call.
- Sibling identifies other B legs that were initiated by this call’s Parent.
- Child identifies calls that were initiated by this call.
- Acquaintance identifies other calls that were in a conference with this call.
- Duration: Duration of the call — the interval between answer time and end time
- Hangup Cause and Hangup Source: Why and how the call was disconnected, as described in our hangup causes and sources documentation
- Start Time: The time at which call was answered.
- Audio Quality: Same as Plivo Quality Score as described above
- Suspected issues: Issues that may have impacted this call’s experience will be displayed here.
Call stats
Post Dial Delay: Length of the interval between when the call was initiated and ringing began
Ring Duration: Length of the interval between when ringing began and the call was answered
Audio quality stats
This section displays audio quality statistics for each stream for the current page‘s call UUID, for the hop either between the Browser SDK and the Plivo web media server or the Plivo media server and the carrier.Note: Audio quality statistics may not be available for all PSTN calls. They are currently only supported for SIP calls made to or from Plivo‘s Browser SDK.
- Jitter: The variance in delay of voice packet transmissions, measured in milliseconds. Jitter can impact voice quality, causing robotic-sounding audio.
- Packet Loss: Loss of voice packets over transmission, as a percentage of overall packet count in the stream. Packet loss can cause broken audio.
- Audio Level: Indicated in decibels (-100dB to 0dB). Low audio levels can result in one-way audio or low audio level issues.
- Packet Count: Total number of voice packets flowing in the stream. A low packet count can indicate a one-way audio issue.
- RTT: Round trip time is the time taken for data to travel to a target destination and back, in milliseconds. A high RTT indicates poor network quality and can result in audio lag.
Reading audio quality stats
Audio quality statistics are displayed in percentiles, which are color-coded to indicate good, average, and bad values. You can see the interpretation for each value by hovering over the info icon.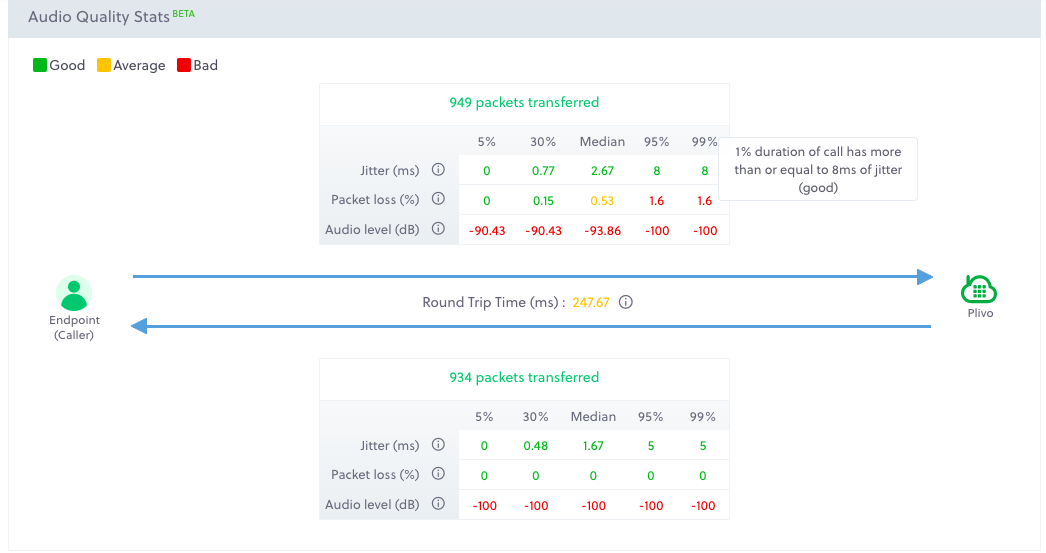
Debugging voice calls
Let’s run through some real-world examples to see how the Call Insights page can help you debug issues. Let’s start by mapping commonly observed audio quality issues to the metrics that directly correlate with them.
Scenario 1: Choppy audio on the call
High jitter causes voice data packets to overlap with each other during transmission, resulting in choppy or broken audio or a robotic audio effect.
To debug this problem, first identify the specific call leg causing an issue — some issues may be caused by a related call leg — then look at the audio stream with the issue to identify the source of the problem.
Step 1: In the console, visit Voice > Logs, select the relevant date range, and click Search. Click on the link in the date column to be redirected to the Call Insights page.
Step 2: Scroll down to the Call Relations section to view call legs related to the current one, where you should see any suspected issues corresponding to each of the related call legs. Identify the leg with choppy audio and click on it (if it’s not the current call leg).
Step 3: Scroll down to the Audio Quality Stats section. The stream with more values in the bad range for Jitter is likely the one with the issue. If it’s a stream coming to Plivo, the cause could be a network issue on the other end. If the other end is a SIP endpoint, the public network may be at fault. If the other end is a PSTN number, there may be an issue with the carrier’s network.
If the jitter is on a stream originating from Plivo, raise a ticket with Plivo support.
Scenario 2: Intermittent loss of audio during the call
High network congestion can sometimes cause packet loss, in which some voice data packets to be discarded or dropped. High packet loss can cause broken audio. The debugging process for this problem is same as that of the prior scenario, except that instead of looking at jitter, we look at packet loss statistics.
Scenario 3: Cannot hear audio on one stream
One-way audio may be caused by a low packet count or low audio level.
- A low packet count value indicates that too few audio packets were received.
- A low audio level points to an issue with the mic.
- An audio level of -100 dB suggests that only silence packets were received on the stream. This may be the case if the device is on mute.
- RTT that’s not in the recommended green range can cause a delay in propagation of voice data packets, resulting in audio delay.
- If you observe high RTT on an inbound SIP leg to Plivo, check the network connectivity on the client endpoint. Low-latency fiber networks offer the best call quality experience. Running calls on cellular data networks can result in higher RTT.
- If the endpoint is behind a VPN, a suboptimal routing based on the VPN IP address may cause the audio delay.
- A SIP endpoint is connected through a VPN, and the VPN IP is not in the same region as the actual device.
- A B-leg call was initiated to a geographic region far from the A-leg — for example, if an incoming call arrives on a Plivo US phone number and is then forwarded to a SIP endpoint in India.